1. Processes, Threads, and Jobs
Although programs and processes appear similar on the surface, they are fundamentally different. A program is a static sequence of instructions, whereas a process
is a container for a set of resources used to execute a program. At the
highest level of abstraction, a Windows process comprises the
following:
A unique identifier called a process ID (PID).
At
least one thread of execution. Every thread in a process has full
access to all the resources referenced by the process container
A private virtual address space, which is a set of virtual memory addresses that the process can use to store and reference data and code
An executable program, which defines initial code and data and is mapped into the process’ virtual address space
A list of open handles to various system resources, such as semaphores, communication ports, and files
A security context called an access token
that identifies the user, security groups, privileges, UAC
virtualization state, LSA logon session ID, and terminal services
session ID
Each process also has a
record of the PID of its parent process. However, if the parent exits,
this information is not updated. Therefore, it is possible for a process
to reference a nonexistent parent or even a different process that has
been assigned the original parent’s PID. A process records its parent
PID only for informational purposes, however.
Windows provides an extension to the process model called a job.
A job object’s main function is to allow groups of processes to be
managed and manipulated as a unit. For example, a job can be used to
terminate a group of processes all at once instead of one at a time and
without the calling process having to know which processes are in the
group. A job object also allows control of certain attributes and
provides limits for the process or processes associated with the job.
For example, jobs can enforce per-process or job-wide limits on
user-mode execution time and committed virtual memory. Windows
Management Instrumentation (WMI) loads its providers into separate host
processes controlled by a job that limits memory consumption as well as
the total number of WMI provider host processes that can run at one
time.
As mentioned, a process is merely a container. Technically, it is not the process that runs—it is its threads. A thread is the entity within a process that Windows schedules for execution, and it includes the following essential components:
The
contents of a set of CPU registers representing the state of the
processor. These include an instruction pointer that identifies the next
machine instruction the thread will execute.
Two stacks, one for the thread to use while executing in kernel mode and one for executing in user mode.
A
private storage area called thread-local storage (TLS) for use by
subsystems, run-time libraries, and dynamic-link libraries (DLLs).
A unique identifier called a thread ID (TID). Process IDs and thread IDs are generated from the same namespace, so they never overlap.
Threads
sometimes have their own security context that is often used by
multithreaded server applications that impersonate the security context
of the clients they serve.
Although threads have their
own execution context, every thread within a process shares the process’
virtual address space (in addition to the rest of the resources
belonging to the process), meaning that all the threads in a process can
write to and read from one another’s memory. Threads cannot reference
the address space of another process, however, unless the other process
makes available part of its private address space as a shared memory section (called a file mapping object in the Windows API) or unless one process has the right to open another process to use cross-process memory functions.
By default, threads don’t
have their own access token, but they can obtain one, thus allowing
individual threads to impersonate a different security context—including
that of a process running on a remote Windows system—without affecting
other threads in the process.
2. User Mode and Kernel Mode
To prevent user applications
from accessing or modifying critical operating system data, Windows
uses two processor access modes: user mode and kernel mode.
All processes other than the System process run in user mode (Ring 3 on
Intel x86 and x64 architectures), whereas device drivers and operating
system components such as the executive and kernel run only in kernel
mode. Kernel mode refers to a mode of execution (Ring 0 on x86 and x64)
in a processor that grants access to all system memory and to all CPU
instructions. By providing the low-level operating system software with a
higher privilege level than user-mode processes have, the processor
provides a necessary foundation for operating system designers to ensure
that a misbehaving application can’t disrupt the stability of the
system as a whole.
Note:
Do not confuse the user-mode
vs. kernel-mode distinction with that of user rights vs. administrator
rights. “User mode” in this context does not mean “has only standard
user privileges.”
Although
each Windows process has its own private memory space, the kernel-mode
operating system and device driver code share a single virtual address
space that is also included in the address space of every process. The
operating system tags each page of virtual memory with the access mode
the processor must be in to read or write the page. Pages in system
space can be accessed only from kernel mode, whereas all pages in the
user address space are accessible from user mode.
Threads of user-mode
processes switch from user mode to kernel mode when they make a system
service call. For example, a call into the Windows ReadFile
API eventually needs to call the internal Windows routine that actually
handles reading data from a file. That routine, because it accesses
internal system data structures, must run in kernel mode. The transition
from user mode to kernel mode is accomplished by the use of a special
processor instruction that causes the processor to switch to a system
service dispatching function in kernel mode. The operating system
executes the corresponding internal function, which for ReadFile is the NtReadFile
kernel function. Kernel service functions validate parameters and
perform appropriate access checks using the Security Reference Monitor
before they execute the requested operation. When the function finishes,
the operating system switches the processor mode back to user mode.
Thus, it is normal for a thread
in a user-mode process to spend part of its time executing in user mode
and part in kernel mode. In fact, because the bulk of the graphics and
windowing system also runs in kernel mode, processes hosting
graphics-intensive applications can spend more of their time in kernel
mode than in user mode. You can see these two modes in the Process
Explorer CPU usage graphs: the red portion of the graph represents time
spent in kernel mode, and the green area of the graph represents time
spent in user mode.
3. Handles
The kernel-mode core of
Windows, which is implemented in Ntoskrnl.exe, consists of various
subsystems such as the Memory Manager, Process Manager, I/O Manager, and
Configuration Manager (registry), which are all parts of the Executive.
Each of these subsystems defines one or more types with the Object
Manager to represent the resources they expose to applications. For
example, the Configuration Manager defines the Key object to represent an open registry key; the Memory Manager defines the Section
object for shared memory; the Executive defines Semaphore, Mutant (the
internal name for a mutex), and Event synchronization objects (which are
objects that wrap fundamental data structures defined by the operating
system’s Kernel subsystem); the I/O Manager defines the File
object to represent open instances of device-driver resources, which
include file system files; and the Process Manager creates Thread and Process
objects. Every release of Windows introduces new object types, with
Windows 7 defining a total of 42. You can see the object types that a
particular version of Windows defines by running the WinObj utility with administrative rights and navigating to the ObjectTypes directory in the Object Manager namespace.
When an application wants to use
one of these resources, it first must call the appropriate API to
create or open the resource. For instance, the CreateFile function opens or creates a file, the RegOpenKeyEx function opens a registry key, and the CreateSemaphoreEx
function opens or creates a semaphore. If the function succeeds,
Windows allocates a reference to the object in the process’ handle
table, which is maintained by the Executive, and returns the index of
the new handle table entry to the application.
This handle value is what
the application uses for subsequent operations on the resource. To query
or manipulate the resource, the application passes the handle value to
API functions such as ReadFile, SetEvent, SetThreadPriority, and MapViewOfFile.
The system can look up the object the handle refers to by indexing into
the handle table to locate the corresponding handle entry, which
contains a pointer to the object. The handle entry also stores the
accesses the process was granted at the time it opened the object, which
enables the system to make sure it doesn’t allow the process to perform
an operation on the object for which it didn’t ask permission. For
example, if the process successfully opened a file for read access but
tried to use the handle to write to the file, the function would fail.
When a process no longer
needs access to an object, it can release its handle to that object,
typically by passing the handle value to the CloseHandle
API. (Note that some resource managers provide a different API to
release its resources.) When a process exits, any handles it still
possesses are closed.
4. Call Stacks and Symbols
Several
Sysinternals utilities—including Process Explorer, Process Monitor, and
VMMap—can display details about the code paths being executed at a
particular point in time called call stacks.
Associating symbols with the modules in a process’ address space
provides more meaningful context information about those code paths,
particularly within Windows operating system code. Understanding call
stacks and symbols, and how to configure them in the Sysinternals
utilities, gives tremendous insight into a process’ behavior and can
often lead to the root cause of a problem.
4.1. What Is a Call Stack?
Executable code in a process
is normally organized as a collection of discrete functions. To perform
its tasks, a function can invoke other functions (subfunctions). When a
function has finished, it returns control back to the function that
called it.
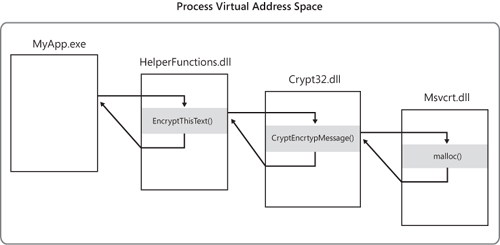
A made-up example, shown in Figure 1, demonstrates this flow. MyApp.exe ships with a DLL named HelperFunctions.dll. That DLL includes a function named EncryptThisText that encrypts text passed to it. After performing some preparatory operations, EncryptThisText calls the Windows API CryptEncryptMessage in Crypt32.dll. At some point, CryptEncryptMessage needs to allocate some memory and invokes the memory-allocation function malloc in Msvcrt.dll. After malloc has done its work and allocated the requested memory, execution resumes at the point where CryptEncryptMessage had left off. And when CryptEncryptMessage has completed its task, control returns back to the point in EncryptThisText just after its call to CryptEncryptMessage.
The call stack
is the construct that allows the system to know how to return control
to a series of callers, as well as to pass parameters between functions
and to store local function variables. It’s organized in a “last in,
first out” manner, where functions remove items in the reverse order
from how they add them. When a function is about to call a subfunction,
it puts the memory address of the next instruction to execute upon
returning from the subfunction (its “return address”) at the top of the
stack. When that subfunction calls yet another function, it adds its own
return address to the stack. On returning from a function, the system
retrieves whatever address is at the top of the stack and begins
executing code from that point.
The convention for displaying a return address in a call stack is module!function+offset, where module is the name of the executable image file containing the function, and offset is the number of bytes (in hexadecimal) past the beginning of the function. If the function name is not available, the address is shown simply as “module+offset”. While malloc is executing in the fictitious example just given, the call stack might look like this:
msvcrt!malloc+0x2a
crypt32!CryptEncryptMessage+0x9f
HelperFunctions!EncryptThisText+0x43
MyApp.exe+0x25d8
As you can see, a call stack not only tells you what piece of code is executing, it also tells you how the program got there.
4.2. What Are Symbols?
When inspecting a thread start
address or a return address on a call stack, a debugger can easily
determine what module it belongs to by examining the list of loaded
modules and their address ranges. However, when a compiler converts a
developer’s source code into computer instructions, it does not retain
the original function names. The one exception is that a DLL includes an
export table
that lists the names and offsets of the functions it makes available to
other modules. However, the export table does not list the names of the
library’s internal functions, nor does it list the names of COM entry
points that are designed to be discovered at runtime.
Note:
Executable files loaded
in user-mode processes are generally either EXE files with which a new
process can be started or DLL files that are loaded into an existing
process. EXE and DLL files are not restricted to using those two file
extensions, however. Files with COM or SCR extensions are actually EXE
files, while ACM, AX, CPL, DRV, and OCX are examples of other file
extensions of DLLs. And installation programs commonly extract and
launch EXE files with TMP extensions.
When creating executable files, compilers and linkers can also create corresponding symbol files
(with the default extension PDB). Symbol files hold a variety of data
that is not needed when running the executable code but which can be
useful during debugging, including the names and entry point offsets of
functions within the module. With this information, a debugger can take a
memory address and easily identify the function with the closest
preceding address. Without symbols, the debugger is limited to using
exported functions, if any, which might have no relation at all to the
code being executed. In general, the larger the offset on a return
address, the less likely the reported function name is to be accurate.
Note:
The Sysinternals utilities are
able to use only native (unmanaged) symbol files when reporting call
stacks. They are not able to report function names within JIT-compiled
.NET assemblies.
A
symbol file must be built at the same time as its corresponding
executable or it will not be correct and the debug engine might refuse
to use it. Older versions of Microsoft Visual C++ created symbol files
only for Debug builds unless the developer explicitly changed the build
configuration. Newer versions now create symbol files for Release builds
as well, writing them into the same folder with the executable files.
Microsoft Visual Basic 6 can create symbol files, but it does not do so
by default.
Symbol files can contain differing levels of detail. Full symbol files (sometimes called private symbol files) contain details that are not found in public symbol files,
including the path to and the line number within the source file where
the symbol is defined, function parameter names and types, and variable
names and types. Software companies that make symbol files externally
available typically release only public symbol files, while retaining
the full symbol files for internal use.
The Debugging Tools for Windows make it possible to download correct symbol files on demand from a symbol server.
The server can store symbol files for many different builds of a given
executable file, and the Debugging Tools will download the one that
matches the image you are debugging. (It uses the timestamp and checksum
stored in the executable’s header as a unique identifier.)
Microsoft has a
symbol server accessible over the Web that makes Windows’ public symbol
files freely available. By installing the Debugging Tools for Windows
and configuring the Sysinternals utilities to use the Microsoft symbol
server, you can easily see what Windows functions are being invoked by
your processes.
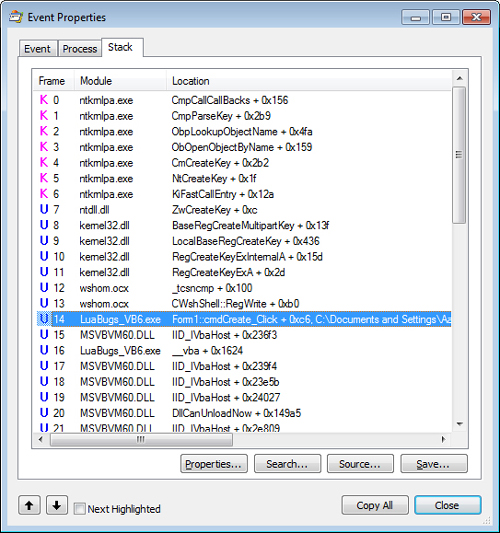
Figure 2
shows a call stack for an event captured with Process Monitor. The
presence of MSVBVM60.DLL on the stack (frames 15 and 17–21) indicates
that this is a Visual Basic 6 program because MSVBVM60.DLL is the Visual
Basic 6 runtime DLL. The large offsets for the MSVBVM60 frames suggest
that symbols are not available for that module and that the names shown
are not the actual functions being called. Frame 14 shows a call into a
function named Form1::cmdCreate_Click
in the main executable (LuaBugs_VB6.exe). This frame also shows a
source file path, indicating that we have full symbolic information for
this third-party module. This function then calls CWshShell::RegWrite
in Wshom.ocx (frame 13), indicating that this Visual Basic 6 program is
using a Windows Script Host ActiveX to write to the registry. CWshShell::RegWrite calls an internal function in the same module (frame 12), which calls the documented RegCreateKeyExA Windows API in Kernel32.dll (frame 11). Execution passes through Kernel32 internal functions (frames 8–10) and then into the ZwCreateKey native API in Ntdll.dll (frame 7). So far, all of these functions have executed in user mode, as indicated by the U in the Frame column, but in frame 6 the program transitions to kernel mode, indicated by the K.
The two-letter prefixes of the kernel functions (frames 0–6) identify
the executive components to which they belong. For example, Cm refers to the Configuration Manager, which is responsible for the registry, and Ob refers to the Object Manager. It was during the processing of CmpCallCallBacks (frame 0) that this stack trace was captured. Note that the symbolic
information shown in frames 0–13 was all derived from Windows public
symbols downloaded on demand by Process Monitor from Microsoft’s symbol
server.
4.3. Configuring Symbols
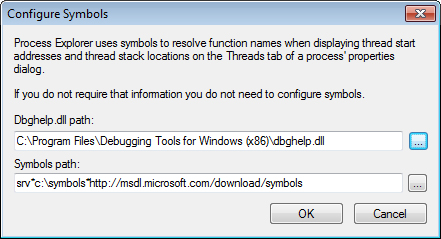
The Sysinternals utilities that use symbols require two pieces of information, as shown in Figure 3:
the location of the Dbghelp.dll to use, and the symbols path. The
Sysinternals utilities that can use full symbolic information to display
source files also request source code paths.
Dbghelp.dll is one of
Microsoft’s debug engine DLLs, and it provides the functionality for
walking a call stack, loading symbol files, and resolving process memory
addresses to names. Only the version of Dbghelp.dll that ships in the
Debugging Tools for Windows supports the downloading of files from
symbol servers. The Dbghelp.dll that ships with Windows in the
%SystemRoot%\System32 directory can use only symbol files stored
locally. The first time you run them, Sysinternals utilities check
default installation locations for the Debugging Tools and use its
Dbghelp.dll if found. Otherwise, it defaults to using the version in
%SystemRoot%\System32.
The URL for the Debugging Tools for Windows is http://www.microsoft.com/whdc/devtools/debugging/default.mspx.
The Debugging Tools installer used to be a standalone download, but it
is now incorporated into the Windows SDK. To get the Debugging Tools,
you must run the SDK installer and select the Debugging Tools options
you want. Among the options are the Debugging Tools redistributables,
which are the standalone Debugging Tools installers, available for x86,
x64, and IA64. The redistributables are handy for installing the
debuggers to other machines in your environment without having to run
the full SDK installer on each of them.
The symbols path tells the
debugging engine where to search for symbol files if they cannot be
found in default locations. The two default locations that the debugging
engine searches for symbol files before checking the symbols path are
the executable’s folder and the folder where the symbol file was
originally created, if that information is in the executable file.
The symbols path can consist
of file system folders and symbol server directives. The first time you
run it, the Sysinternals utility will set its symbol path to the value
of the _NT_SYMBOL_PATH environment variable. If that variable is not
defined, the utility sets its symbol path to srv*http://msdl.microsoft.com/download/symbols, which uses the Microsoft public symbol server but does not save the downloaded symbol files to a local cache.
File system folders and
symbol server directives can be intermixed in the symbols path,
separated with a semicolon. Each element is searched in the order it
appears in the path. As implied earlier, symbol server directives are of
the form srv*DownstreamStore*SymbolServer. Consider the following
symbols path:
C:\MySyms;srv*C:\MSSymbols*http://msdl.microsoft.com/download/symbols
The
debugging engine will first search the default locations and then
C:\MySyms, which could be a good place to put your own applications’
private symbol files. If it hasn’t found the symbol file, it then
searches C:\MSSymbols, and if the file isn’t there it finally queries
the symbol server. If the symbol server has the file, the debugging
engine downloads the file to C:\MSSymbols.
See the Debugging
Tools documentation for more information about symbol paths, symbol
servers, source paths, and environment variables used by the debugging
engine.
Tip:
If the Microsoft public symbols are the only symbols you need, set the symbols path to the following:
srv*c:\symbols*http://msdl.microsoft.com/download/symbols
This directs the debugging
engine first to search the cache under C:\Symbols and then to download
symbol files as needed from the Microsoft public symbol server, saving
them into the cache so that they won’t need to be downloaded again. The
debugging engine will create C:\Symbols if it doesn’t already exist.